Mind mapping is a powerful and versatile tool that can revolutionize the way you plan and design employee training programs. Unlike traditional linear approaches, mind maps leverage the natural cognitive tendencies of the human brain to capture, organize, and visualize complex information in a structured yet flexible manner.
What is a Mind Map?
A mind map is a diagrammatic representation of information, ideas, and concepts. It typically starts with a central topic or theme, from which branches radiate outward to capture related subtopics, details, and connections. This visual mapping process aligns with how the brain naturally processes and associates information, making it easier to understand, remember, and build upon.
The Advantages of Mind Mapping for Training Design
- Holistic Visualization: Mind maps provide a comprehensive, birds-eye view of the entire training program, allowing you to see the big picture and the interdependencies between different elements. This helps you identify gaps, streamline the curriculum, and ensure a cohesive learning experience.
- Nonlinear Ideation: The open-ended nature of mind maps encourages divergent thinking and facilitates the brainstorming process. You can freely explore and connect ideas without being constrained by a rigid, linear structure, leading to more creative and innovative training solutions.
- Adaptability and Flexibility: As your training needs evolve, mind maps can be easily updated, rearranged, and refined without having to start from scratch. This agility allows you to respond to changing requirements and continuously improve the program.
- Enhanced Engagement: By presenting information in a visually appealing and intuitive manner, mind maps can captivate your audience and make the training more engaging and memorable for the participants.
Applying Mind Mapping to the Training Design Process
The mind map in the image provides a useful framework for designing an effective employee training program. Let’s explore the key elements:
Meeting Objective: Clearly define the primary purpose and goals of the training, establishing a clear direction for the program.
Topic Prioritization: Identify the key focus areas, training content, and delivery methods based on the identified needs and skill gaps.
Time Allocation: Allocate dedicated time for various aspects of the training design, ensuring a balanced and well-structured program.
Participant Engagement: Incorporate interactive techniques and opportunities for participants to contribute their insights and experiences, fostering active engagement.
Documentation and Follow-up: Ensure a comprehensive training plan is documented, and establish a process for ongoing evaluation and continuous improvement.
By embracing the mind mapping approach, you can streamline the training design process, promote collaboration, and create a training program that resonates with your employees and delivers tangible, measurable outcomes.
The mind map below depicts a mind map for designing an effective employee training program. Let me provide a textual description of the key elements:
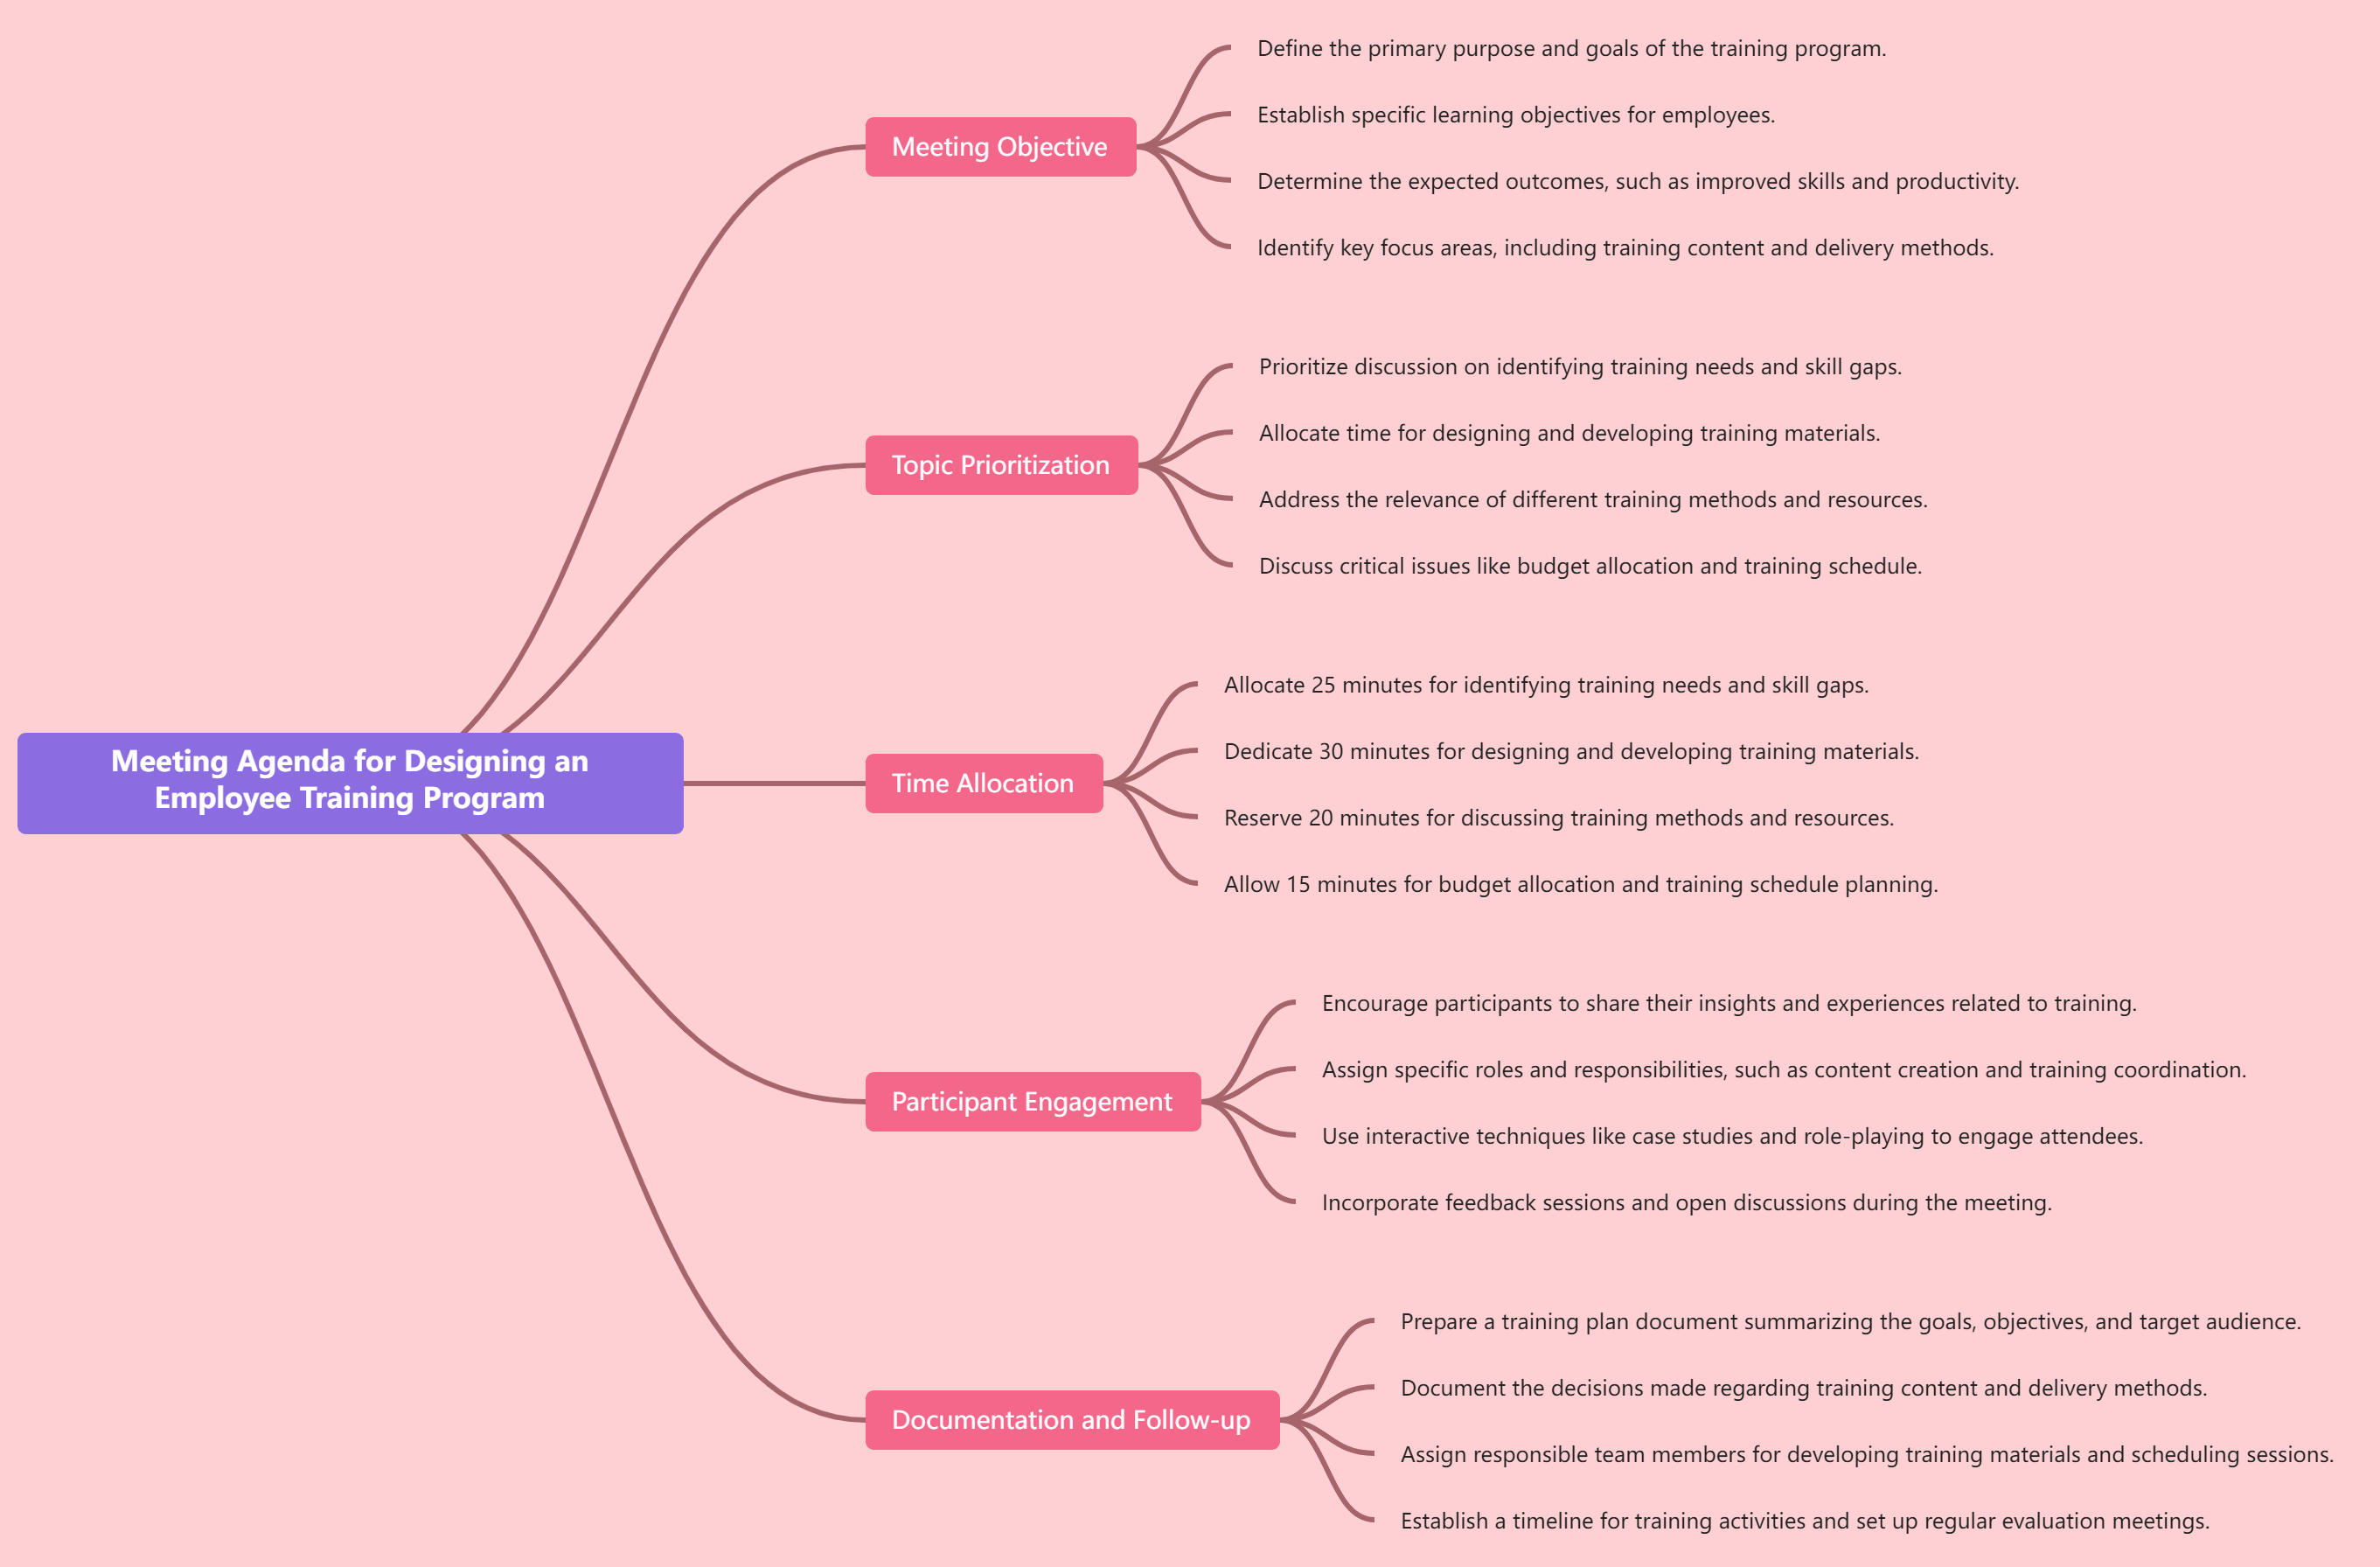
Meeting Agenda for Designing an Employee Training Program:
This forms the central topic or focus of the mind map.
The main branches radiating from the central topic are:
- Meeting Objective:
- Define the primary purpose and goals of the training program.
- Establish specific learning objectives for employees.
- Determine the expected outcomes, such as improved skills and productivity.
- Identify key focus areas, including training content and delivery methods.
- Topic Prioritization:
- Prioritize discussion on identifying training needs and skill gaps.
- Allocate time for designing and developing training materials.
- Address the relevance of different training methods and resources.
- Discuss critical issues like budget allocation and training schedule.
- Time Allocation:
- Allocate 25 minutes for identifying training needs and skill gaps.
- Dedicate 30 minutes for designing and developing training materials.
- Reserve 20 minutes for discussing training methods and resources.
- Allow 15 minutes for budget allocation and training schedule planning.
- Participant Engagement:
- Encourage participants to share their insights and experiences related to training.
- Assign specific roles and responsibilities, such as content creation and training coordination.
- Use interactive techniques like case studies and role-playing to engage attendees.
- Incorporate feedback sessions and open discussions during the meeting.
- Documentation and Follow-up:
- Prepare a training plan document summarizing the goals, objectives, and target audience.
- Document the decisions made regarding training content and delivery methods.
- Assign responsible team members for developing training materials and scheduling sessions.
- Establish a timeline for training activities and set up regular evaluation meetings.
This comprehensive mind map provides a structured approach to designing an effective employee training program, covering key aspects such as setting objectives, prioritizing topics, allocating time, engaging participants, and ensuring proper documentation and follow-up.
How to Create and Organize a Mind Map
Visual Paradigm’s Smart Board, a dynamic and user-friendly mind mapping tool, empowers users with eight distinct diagram types, each meticulously designed to address specific challenges and foster clear thinking. By harnessing these diagrams, you can efficiently organize ideas, plan projects, and communicate intricate information with ease. Let’s dive into each diagram type, exploring their unique structures, features, and practical use cases.
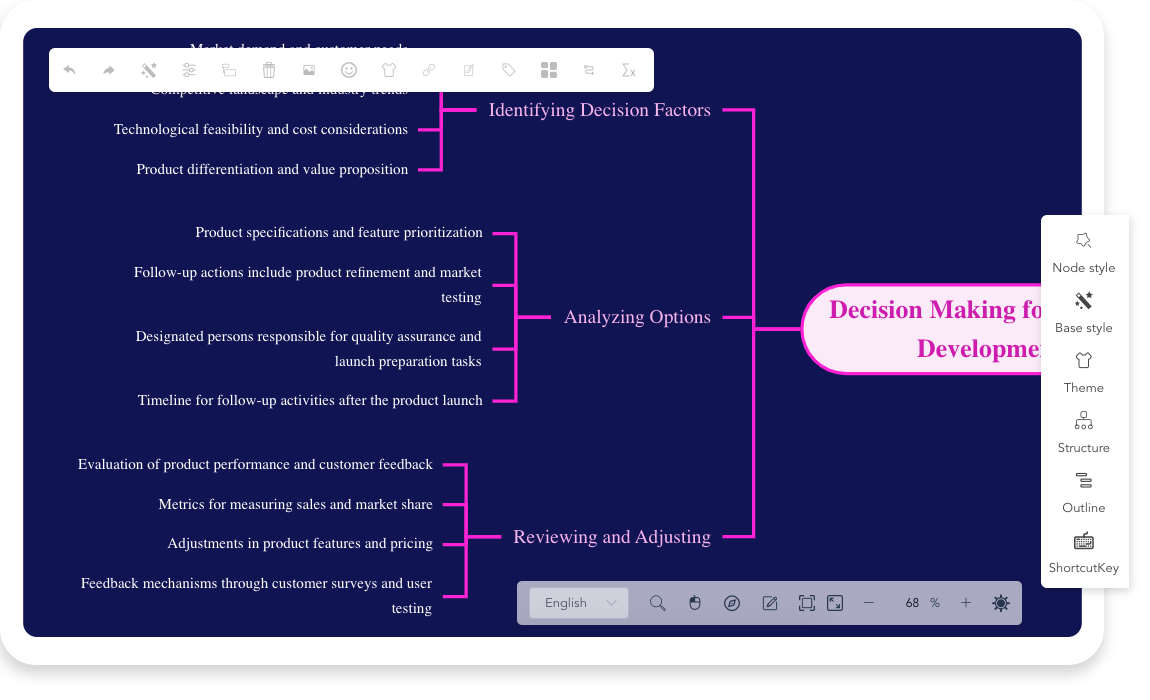
1. Mind Map
- Structure: A central idea branches out, connected to subtopics and details.
- Use Cases: Brainstorming, project planning, decision-making, and thought organization.
- Key Features: Enables users to visualize the big picture while exploring details, stimulating creativity and connections between ideas.
2. Family Tree
- Structure: Hierarchical, with a root node at the top and branches representing generations or relationships.
- Use Cases: Genealogy, lineage tracking, and visualizing hierarchical structures in organizations or systems.
- Key Features: Clearly displays relationships, making it easy to understand family connections or organizational structures.
3. Concept Map
- Structure: An interconnected network of concepts, with labeled links showing relationships between them.
- Use Cases: Knowledge mapping, understanding complex systems, and communicating ideas in education.
- Key Features: Assists users in identifying and connecting key concepts, promoting a deeper understanding of the subject matter.
4. Organizational Chart (Org Chart)
- Structure: Hierarchical, with a clear top-down structure, representing roles, responsibilities, and reporting relationships.
- Use Cases: Visualizing corporate or team structures, planning organizational changes, and defining roles.
- Key Features: Provides a clear overview of the organizational hierarchy, facilitating better communication and decision-making.
5. Brace Map
- Structure: Hierarchical, with multiple branches radiating from a central node, focusing on a single theme or goal.
- Use Cases: Setting goals, planning projects, and breaking down complex tasks into manageable steps.
- Key Features: Encourages users to focus on a central objective while organizing related tasks and responsibilities.
6. Fishbone Diagram
- Structure: A horizontal line represents a problem or goal, with causes and effects branching out like a fishbone.
- Use Cases: Identifying root causes of problems, improving processes, and brainstorming solutions.
- Key Features: Helps users analyze problems systematically by breaking down causes and effects, facilitating problem-solving and continuous improvement.
7. Tree Chart
- Structure: Hierarchical, with a single root node at the top, branching out into subtopics, and optionally further branching into sub-subtopics.
- Use Cases: Visualizing hierarchical data, planning projects with phases or milestones, and organizing information.
- Key Features: Offers a clear overview of hierarchical data, making it easy to understand and navigate complex structures.
8. Bubble Map
- Structure: A hierarchical map with nodes of varying sizes, representing the importance or magnitude of the topic.
- Use Cases: Prioritizing tasks or ideas, visualizing market research data, and comparing different factors.
- Key Features: Allows users to emphasize key topics, providing additional context and promoting a better understanding of the data.
By mastering these eight diagram types in Visual Paradigm’s Smart Board, you can overcome a wide array of challenges and communicate intricate information more effectively. Whether you’re planning a project, organizing thoughts, or solving complex problems, Smart Board’s versatile diagramming capabilities have you covered. Embrace these diagram types today and harness the power of visual thinking to drive success.
Start your visual thinking journey with Smart Board and unleash the full potential of these eight powerful diagrams.
5W’s (Who, What, Where, When, Why)
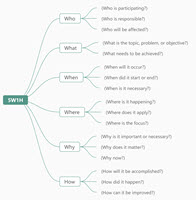
5W1H

5W’s For Implementation of Renewable Energy in a Small Town
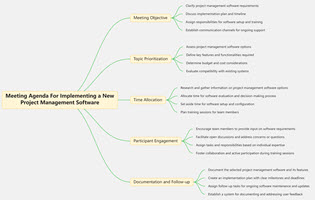
Meeting Agenda For Implementing a New Project Management Software
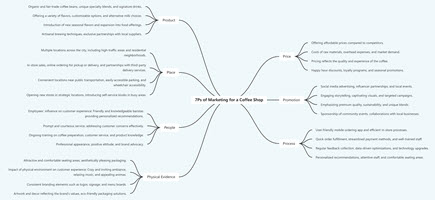
7Ps of Marketing for a Coffee Shop
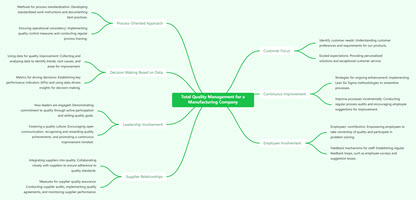
Total Quality Management for a Manufacturing Company
