An organization chart is a visual representation that depicts the hierarchical structure of an organization. It illustrates the relationships and ranks of the organization’s members and departments.
Key features of an organization chart include:
- Hierarchical Structure:
- The chart shows the reporting relationships and chain of command within the organization.
- It typically starts with the highest-level position, such as the CEO or president, and branches out to lower-level roles and departments.
- Roles and Responsibilities:
- The organization chart defines the different positions and their corresponding roles and responsibilities.
- It helps employees, stakeholders, and new hires understand the scope of each position within the organization.
- Communication and Decision-Making:
- The chart provides a clear visual representation of the lines of communication and decision-making within the organization.
- It helps employees understand the appropriate channels for reporting, escalating issues, and seeking approvals.
- Organizational Change Management:
- When an organization undergoes restructuring or expansion, the organization chart can effectively communicate the changes and their implications.
- It helps maintain clarity and transparency during periods of organizational transformation.
- Operational Efficiency:
- The organization chart can assist in identifying areas for process improvements, resource allocation, and talent management.
- By clearly defining the roles and relationships, it can help streamline operations and enhance organizational effectiveness.
Overall, an organization chart is a valuable tool for businesses, institutions, and enterprises to visualize their structure, foster communication, define responsibilities, and support organizational development and change management.
When and Why to Create an Organization Chart
Organization charts are valuable tools for various purposes:
- Visualizing Organizational Structure: An organization chart provides a clear, hierarchical representation of an organization’s structure, showing the reporting relationships, roles, and responsibilities of each member.
- Facilitating Communication: The organization chart helps employees, stakeholders, and new hires understand the lines of communication and decision-making within the organization.
- Identifying Roles and Responsibilities: By clearly defining the positions and their relationships, an organization chart can help employees understand their roles and the scope of their responsibilities.
- Streamlining Operations: An organization chart can assist in identifying areas for process improvements, resource allocation, and talent management.
- Supporting Organizational Change: When an organization undergoes restructuring or expansion, an up-to-date organization chart can help communicate the changes and their implications.
How to Create an Organization Chart using Visual Paradigm Smart Board
- Access the Visual Paradigm Smart Board: Open the Visual Paradigm application and navigate to the “Smart Board” feature.
- Create a New Organization Chart: Click on the “Create New” button and select the “Organization Chart” option to start designing your chart.
- Edit the Text Content: Double-click on the initial node (typically representing the organization’s top-level position) and edit the text to reflect the appropriate title or role.
- Insert Sibling Nodes: To add a new position at the same level, press “Enter” on your keyboard. This will insert a new sibling node.
- Insert Child Nodes: To create a subordinate position, click on the node and press the “Tab” key. This will insert a child node beneath the selected position.
- Utilize the Toolbar Buttons: The toolbar in the Smart Board provides additional options for adding, deleting, and arranging nodes. You can use these buttons to quickly manage the structure of your organization chart.
- Apply Themes and Customize Styling: In the “Theme Palette,” you can select from pre-made themes to quickly change the overall style of your organization chart. If you have customized the node styles, the system will prompt you to decide whether to overwrite the settings or keep your own.
- Adjust Background and Node Colors: Under the “Base Style” and “Node Style” options, you can further customize the background color and node colors to match your organization’s branding or preferences.
- Export the Organization Chart: Once you’re satisfied with your organization chart, select the “Export” option to save the image in PNG format.
Guidelines and Examples
- Keep the Structure Simple and Intuitive: Avoid creating overly complex organization charts that can be difficult to navigate. Aim for a clean and straightforward layout.
- Use Consistent Terminology: Ensure that the position titles and job descriptions used in the organization chart are aligned with the actual roles and responsibilities within the organization.
- Adjust the Layout as Needed: Experiment with different node arrangements, spacing, and alignments to achieve a visually appealing and well-organized chart.
Consider Including Additional Information: Depending on your needs, you can add supplementary details like contact information, department names, or icons to enhance the clarity of the organization chart.
Elevate Your Ideation with Visual Paradigm Smart Board
Unlock the power of visual thinking with Visual Paradigm Smart Board, the premier mind mapping solution designed to catalyze creativity and boost productivity. Boasting a seamless, user-friendly interface and a comprehensive template library, this innovative tool empowers you to effortlessly craft mind maps tailored to diverse applications, from organizational structures and project plans to strategic analyses and beyond.
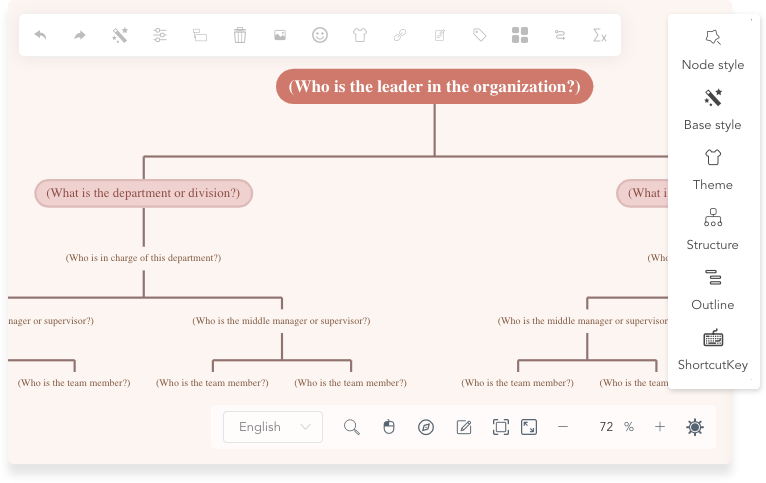
Whether you’re spearheading a brainstorming session, managing a complex project, or formulating a strategic roadmap, Visual Paradigm Smart Board offers unparalleled versatility. Its intuitive design and robust features foster a dynamic, collaborative environment, enabling teams to ideate, plan, and execute with unparalleled efficiency.
Elevate your mind mapping prowess and unlock new levels of innovation across industries. With Visual Paradigm Smart Board, the path to transformative ideas and impactful outcomes has never been clearer. Experience the future of mind mapping and unlock your full creative potential today.
Learn More Organization Chart Examples
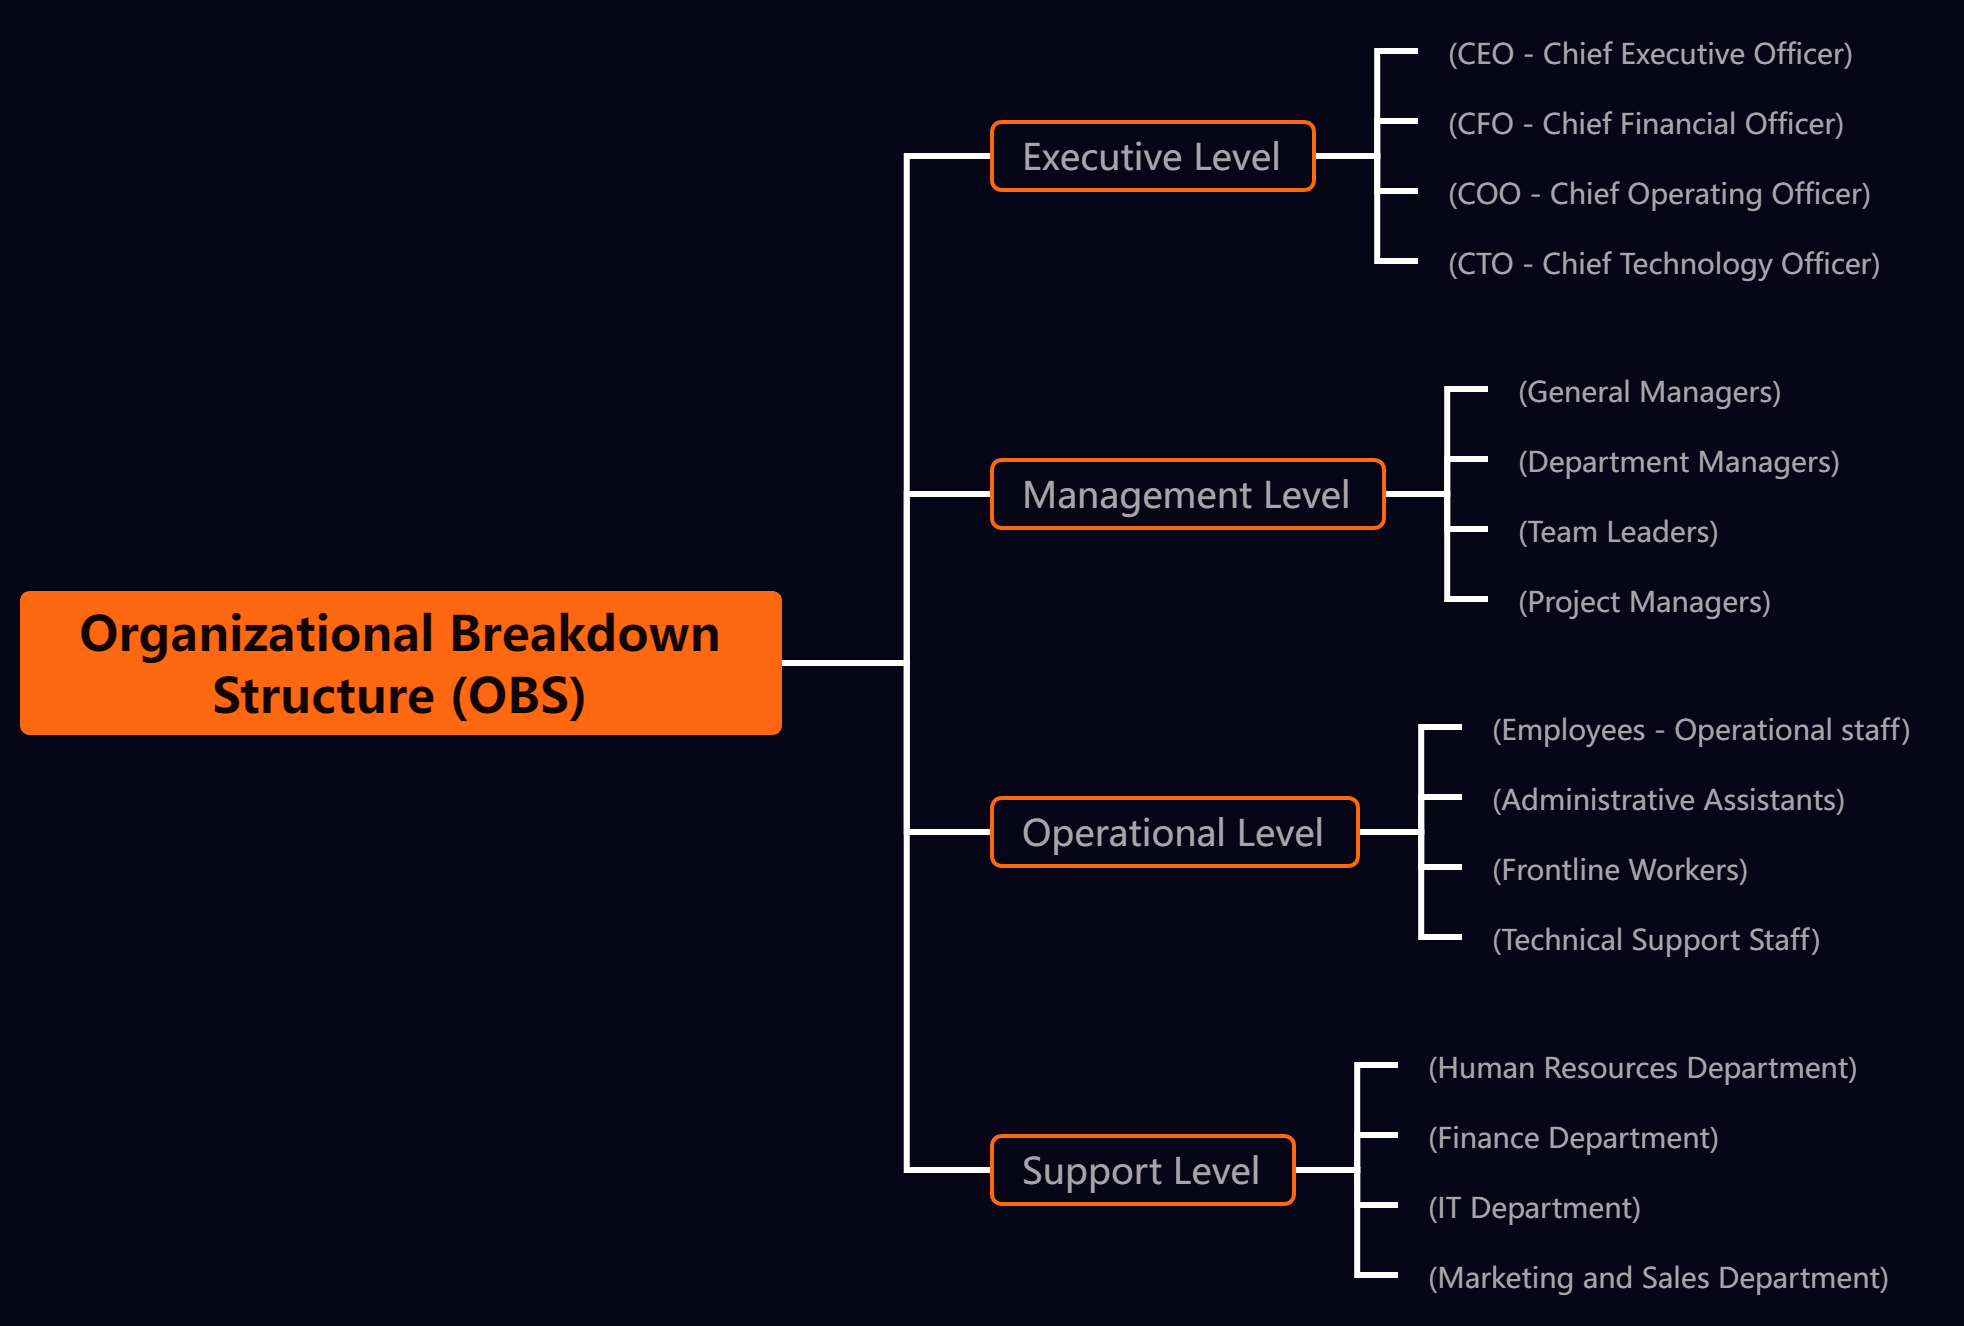
Organizational Breakdown Structure (OBS)
Based on the Organizational Breakdown Structure (OBS) shown in the image, here is an example of how it can be represented in textual form:
Organizational Breakdown Structure (OBS)
Executive Level:
- CEO – Chief Executive Officer
- CFO – Chief Financial Officer
- COO – Chief Operating Officer
- CTO – Chief Technology Officer
Management Level:
- General Managers
- Department Managers
- Team Leaders
- Project Managers
Operational Level:
- Employees – Operational staff
- Administrative Assistants
- Frontline Workers
- Technical Support Staff
Support Level:
- Human Resources Department
- Finance Department
- IT Department
- Marketing and Sales Department
This textual representation of the OBS aligns with the hierarchical structure depicted in the image, clearly delineating the different levels (Executive, Management, Operational, and Support) and the corresponding roles or departments within each level.
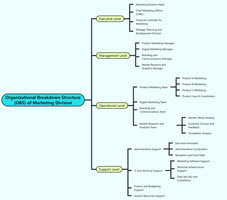
Organizational Breakdown Structure (OBS) of Marketing Division
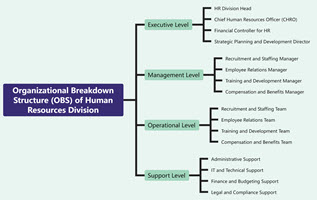
Organizational Breakdown Structure (OBS) of Human Resources Division
