A timeline is a visual representation that displays a chronological sequence of events or activities over a specific period of time. Timelines are widely used in various contexts to effectively communicate the progression and relationships between different occurrences.
What is a timeline?
- A timeline is a graphical tool that arranges information in a linear, chronological order.
- It serves as a way to visualize the sequence of events, milestones, or key moments within a given timeframe.
- Timelines can cover a wide range of topics, such as historical events, project management, personal biography, or the development of a product or organization.
Why use a timeline?
- Timelines provide a clear and structured way to present complex information in an easily digestible format.
- They help viewers understand the temporal relationships between different events, making it easier to identify patterns, trends, and dependencies.
- Timelines can be used for various purposes, such as:
- Documenting the history of an organization or individual
- Planning and tracking the progress of a project
- Visualizing the evolution of a product or technology
- Educating and informing audiences about historical events or processes
How to create a timeline?
- Identify the relevant events, milestones, or key moments to include in the timeline.
- Arrange these events in chronological order, with the earliest event at the start and the latest at the end.
- Determine the appropriate time scale (e.g., years, months, days) based on the scope and level of detail required.
- Choose a visual format that best suits the information, such as a horizontal bar chart, vertical list, or a more interactive, web-based timeline.
- Include additional details, such as event descriptions, dates, and any relevant images or graphics, to provide context and enhance the visual appeal.
Example:

The image depicts a timeline structure with several key elements:
- “What is the theme?” – This is the overarching topic or theme of the timeline.
- “What is the start date?” – This represents the beginning of the timeline.
- “What is the date?” – This prompts for the specific date associated with the timeline.
- “What is the major event?” – This asks for the main event or focus of the timeline at that particular date.
- “What are the details about the event?” – This allows for providing more information about the major event.
- “What is the end date?” – This represents the conclusion or end of the timeline.
The timeline is structured in a hierarchical manner, with the overarching theme at the top, followed by the start date, date, major event, and end date. At each step, there are fields to input the specific details about the event or timeline marker. This format allows for a comprehensive and organized presentation of a sequence of events or a historical timeline.
Timeline Example for a Technology Company
A timeline depicting the history of a technology company could include the following elements:
- Year 1995: Company founded
- Year 2000: First product launch
- Year 2005: Expansion into new market
- Year 2010: Acquisition of a competitor
- Year 2015: Release of a groundbreaking new technology
- Year 2020: Celebration of the company’s 25th anniversary
By presenting this information in a visual timeline format, the audience can easily understand the chronological progression of the company’s key events and milestones, making it more engaging and informative.
Creating a Timeline Mind Map with Visual Paradigm’s Smart Board
Visual Paradigm’s Smart Board is an invaluable tool for effortlessly crafting visually engaging timelines. Boasting a user-friendly interface and straightforward features, Smart Board empowers users to create timelines efficiently, allowing them to effectively communicate the chronological progression of events.
In this step-by-step guide, we will walk you through the process of utilizing Visual Paradigm’s Smart Board to design timelines that clearly and concisely present your narrative.
Key Highlights:
- Intuitive Timeline Creation: Smart Board’s intuitive tools make it easy to build timelines, from adding events and milestones to arranging them in a logical sequence.
- Customizable Formatting: Leverage the platform’s versatile formatting options to tailor the timeline’s appearance, including adjusting node shapes, colors, fonts, and other visual elements.
- Hierarchical Organization: Organize related events by creating parent-child relationships, ensuring your timeline maintains a clear and structured flow.
- Flexible Layout Options: Experiment with different layout orientations, such as horizontal or vertical, to find the most suitable representation for your data.
- Seamless Sharing and Exporting: Once your timeline is complete, share it with others or export it in various formats, including PNG, JPEG, and PDF, for easy integration into reports, presentations, or websites.
By harnessing the power of Visual Paradigm’s Smart Board, you can effortlessly craft captivating timelines that effectively communicate the historical progression of your business, project, or any other narrative. Dive in and unlock the full potential of this versatile tool to elevate your visual storytelling.
- Getting Started
- Log in or sign up for a Visual Paradigm Online account to access the Smart Board feature.
- Click on “Create New” and select “Timeline” from the available templates.
- Structuring the Timeline
- The timeline will be displayed with a central node representing the main timeline.
- Add events or milestones to the timeline by clicking the “+” button to insert new nodes.
- Arrange the nodes in chronological order by dragging and dropping them along the timeline.
- Double-click on each node to edit the text and provide details about the corresponding event or milestone.
- Customizing the Timeline
- Adjust the appearance of the timeline by modifying the node shapes, colors, fonts, and other visual elements.
- Use the various formatting tools available in the Smart Board to enhance the overall aesthetics and readability of the timeline.
- Add icons, images, or other visual aids to provide context and make the timeline more engaging.
- Organizing the Timeline
- Group related events or milestones by creating parent-child relationships between nodes.
- Use the hierarchy tools to indent or outdent nodes, creating a structured and easy-to-navigate timeline.
- Experiment with different layout options, such as horizontally or vertically oriented timelines, to find the most suitable representation for your data.
- Sharing and Exporting the Timeline
- Once the timeline is complete, you can share it with others by generating a shareable link or embedding it on a website.
- To save the timeline, click on the “Export” button and select the preferred format, such as PNG, JPEG, or PDF.
- The timeline can be further integrated into reports, presentations, or any other documents by inserting the exported image.
By leveraging the powerful features of Visual Paradigm’s Smart Board, you can create captivating and informative timelines that effectively communicate the historical progression of your business or project. The intuitive interface and versatile customization options allow you to tailor the timeline to your specific needs, ensuring a clear and visually appealing representation of your data.
Learn More Timeline Examples

Timeline

Timeline of NGO Organization

Timeline of Advertising Company
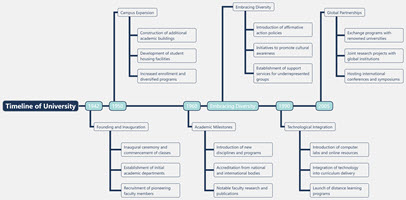
Timeline of University
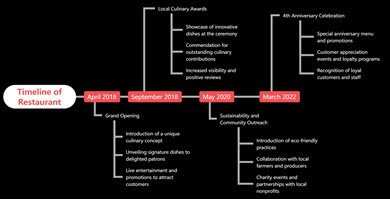
Timeline of Restaurant
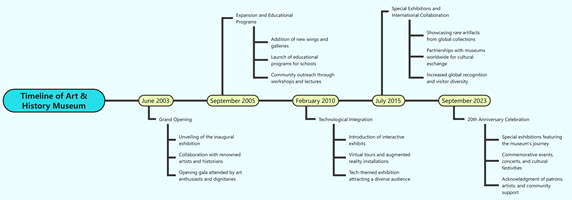
Timeline of Art & History Museum

Timeline of Coffee House
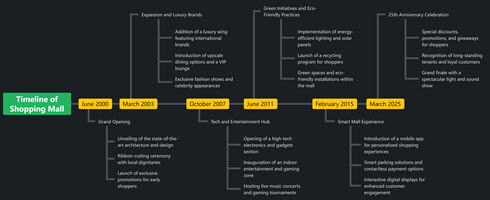
Timeline of Shopping Mall

Timeline of Bar
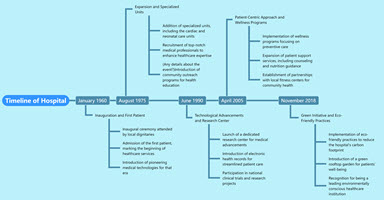
Timeline of Hospital
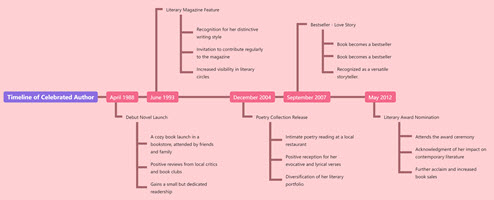
Timeline of Celebrated Author
