Comprehensive Guide to Brainstorming from a Mind Map on PEST Analysis
Introduction to PEST Analysis
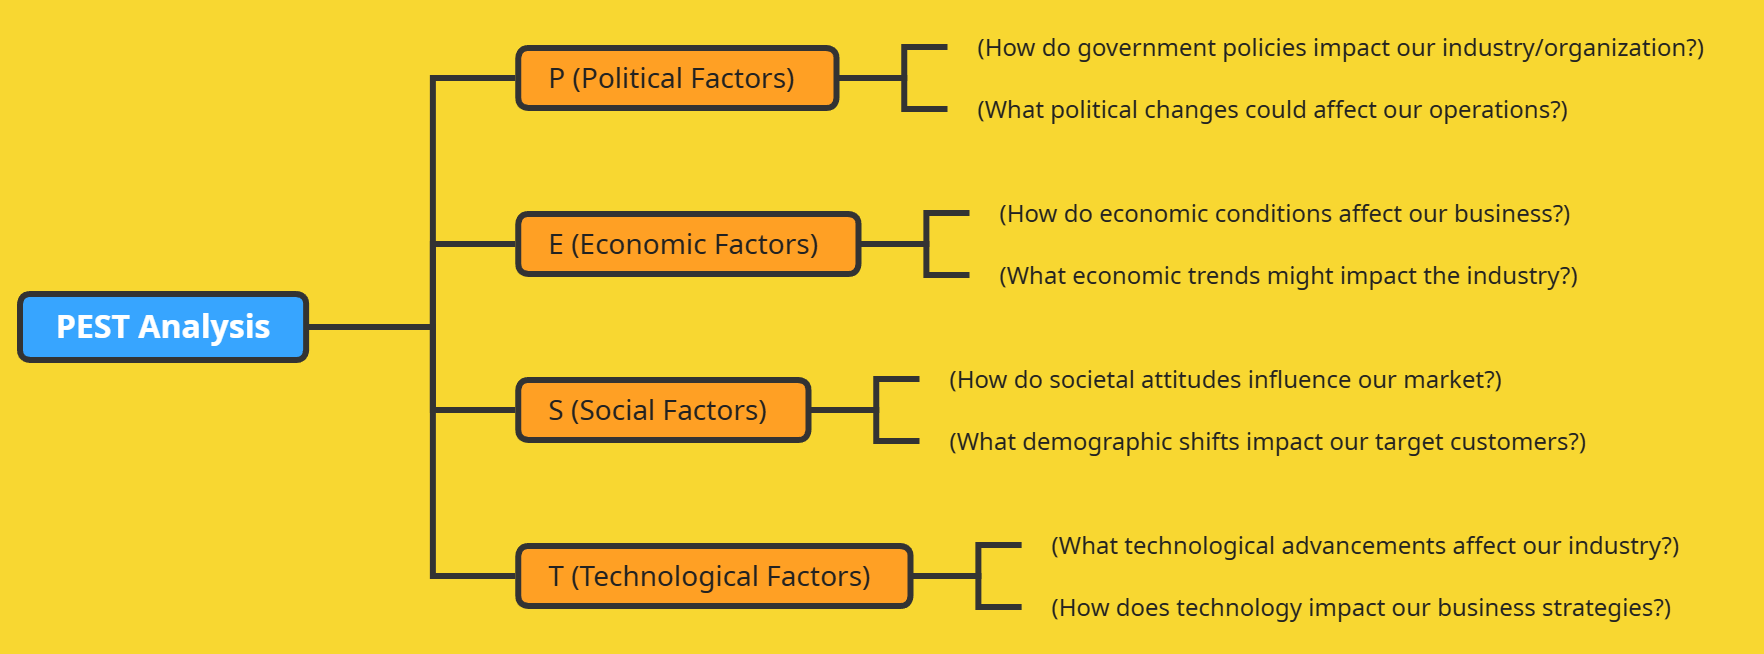
PEST analysis is a strategic management tool used to assess the external macro-environmental factors affecting an industry or organization. The acronym PEST stands for Political, Economic, Social, and Technological factors. This analysis helps businesses understand the …
Comprehensive Guide to SWOT Analysis of Organic Farming
Introduction
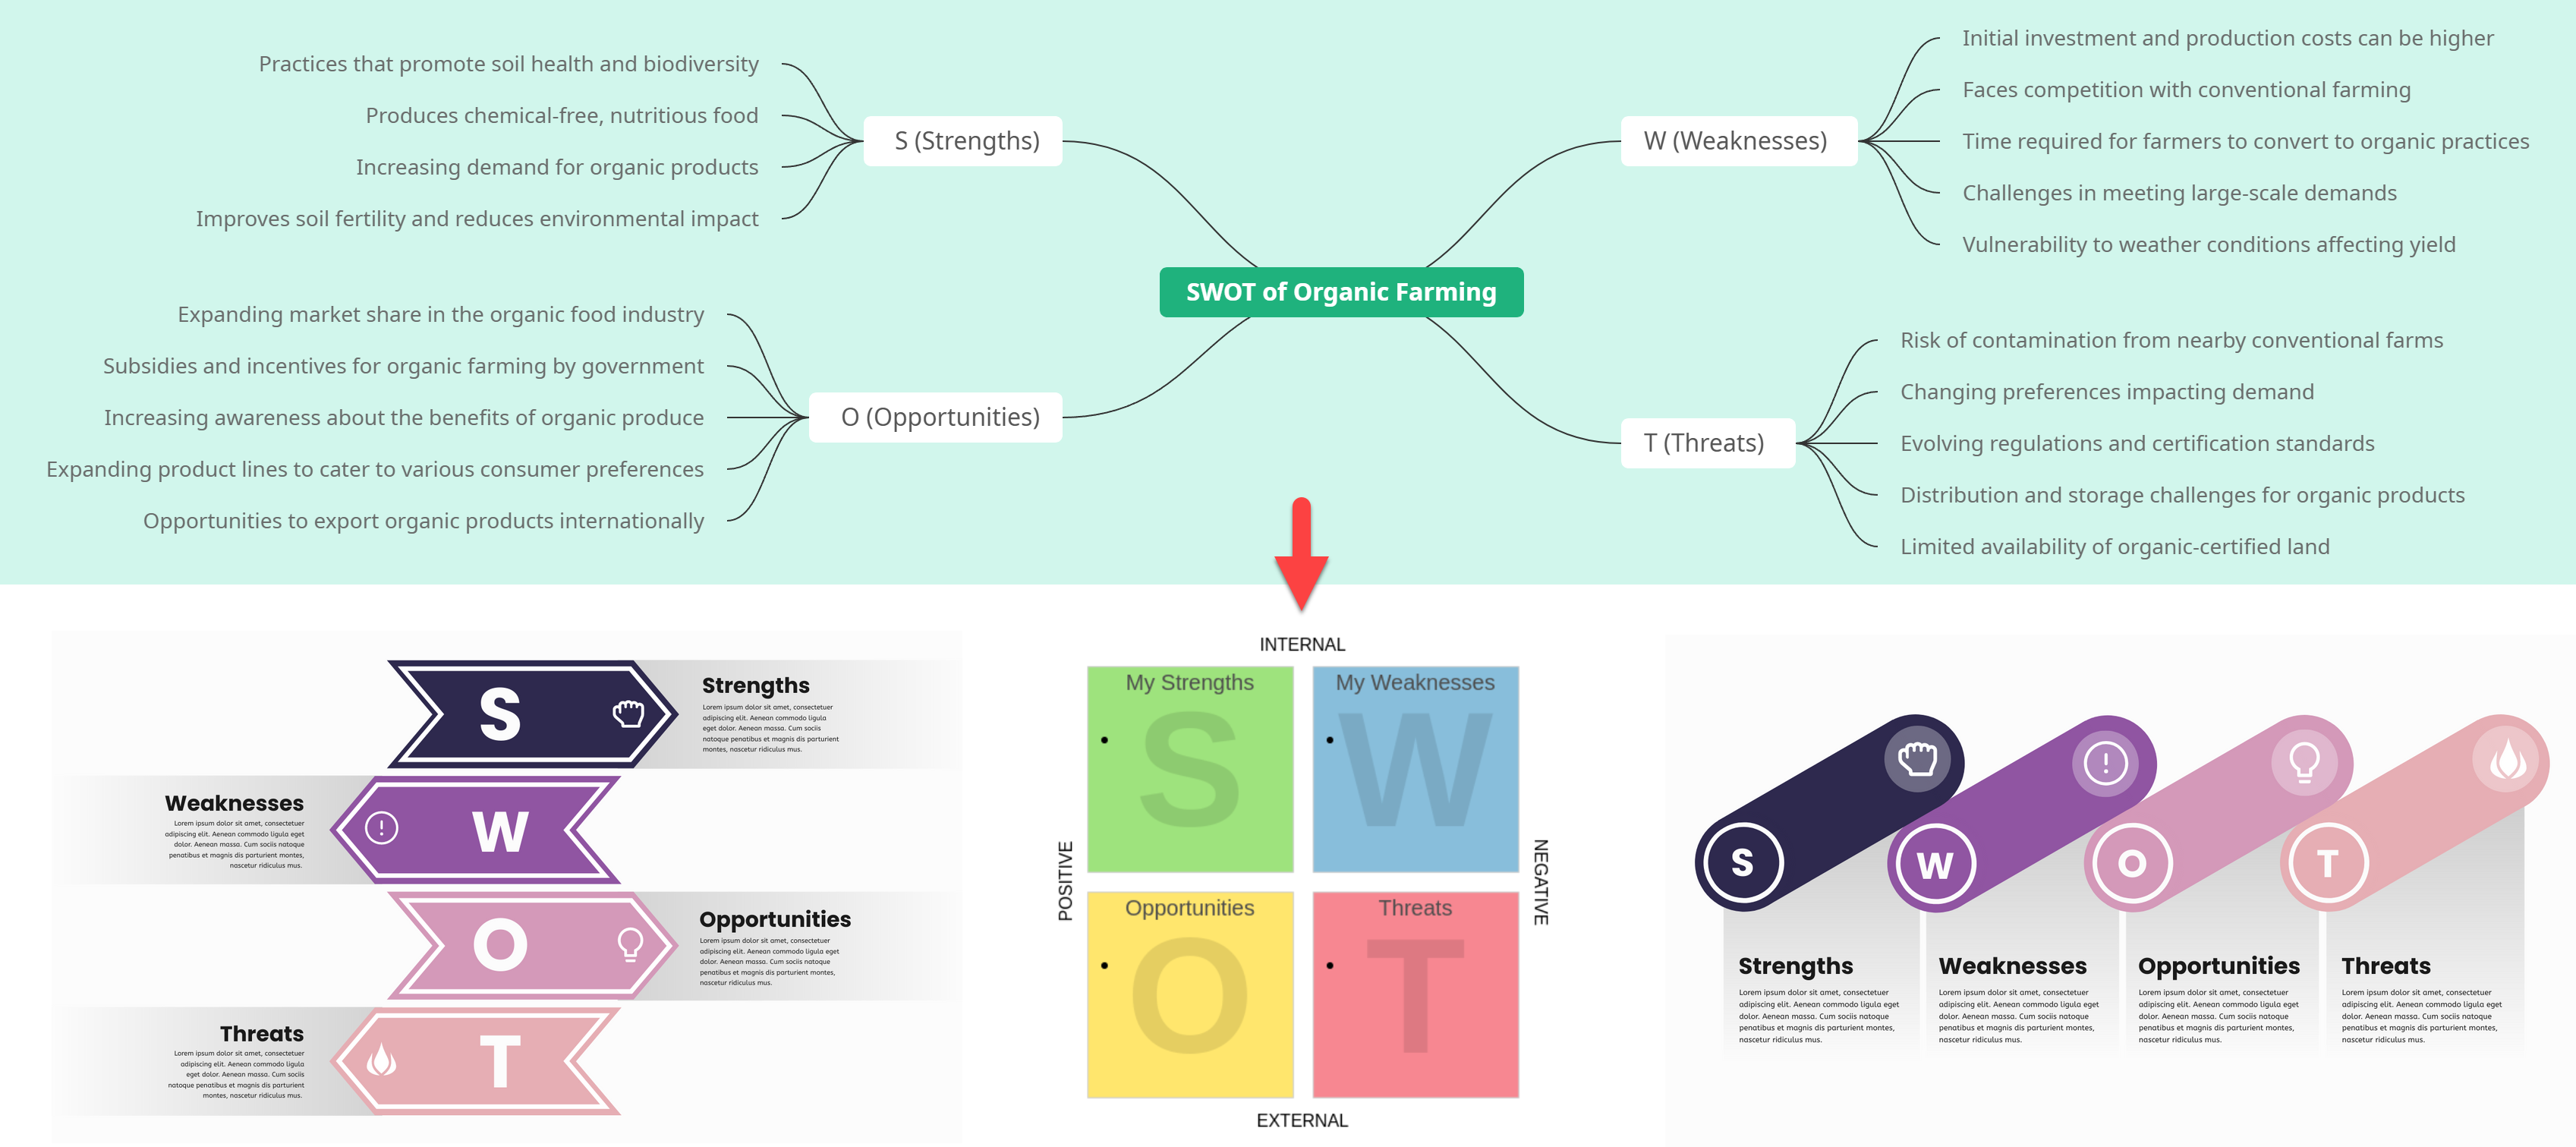
Organic farming is a sustainable and environmentally friendly approach to agriculture that prioritizes natural methods over synthetic inputs. This guide will provide a detailed SWOT analysis of organic farming, examining its Strengths, Weaknesses, Opportunities, and Threats. Additionally, we will …
Comprehensive Guide to Implementing the McKinsey 7-S Framework for Improving Customer Experience in the E-commerce Industry
Introduction
The McKinsey 7-S Framework is a strategic tool used to analyze and improve the effectiveness of an organization by examining seven key elements: Shared Values, Strategy, Structure, Systems, Style, Staff, and Skills.
This guide will provide a detailed explanation …
Deep Dive into the 7Ps Marketing Mix Mind Map
The 7Ps Marketing Mix framework is essential for developing effective marketing strategies. By utilizing a mind map to explore each of the 7Ps—Product, Price, Place, Promotion, People, Process, and Physical Evidence—teams can generate ideas and visualize their marketing approach comprehensively. …
Comprehensive Guide to Creating an Organizational Chart for a School Department with Visual Paradigm Smart Board
Introduction
An organizational chart is a visual representation of the hierarchical structure within an organization, providing a clear overview of its various departments, divisions, and the relationships between them. This guide will walk you through the process of creating an …
Comprehensive Guide to Using the Ansoff Matrix with Visual Paradigm Smart Board
Introduction
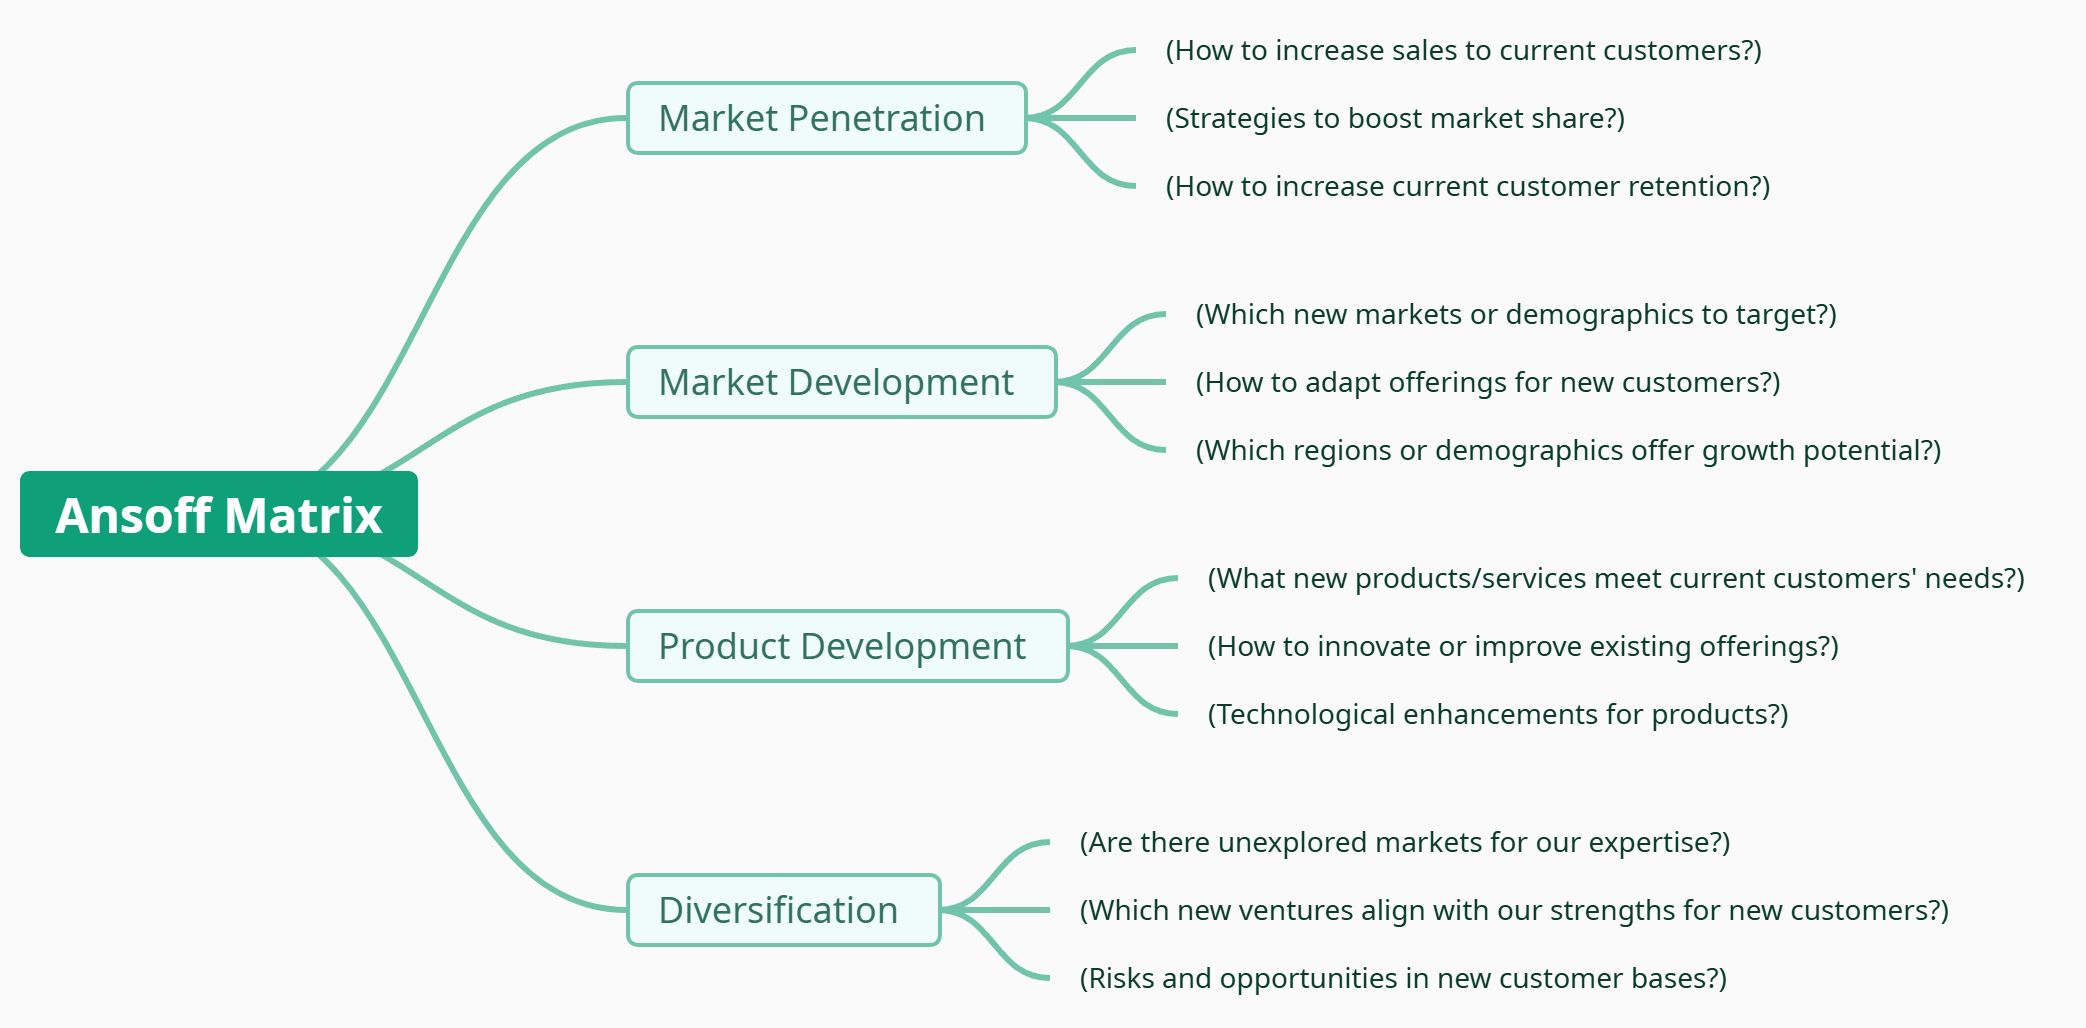
The Ansoff Matrix is a strategic planning tool that provides a framework for businesses to think about their growth and expansion strategies. Developed by Igor Ansoff, this matrix helps organizations consider four key strategies: Market Penetration, Market Development, Product …
Step-by-Step Guide to Create a Mind Map with Visual Paradigm’s Smart Board
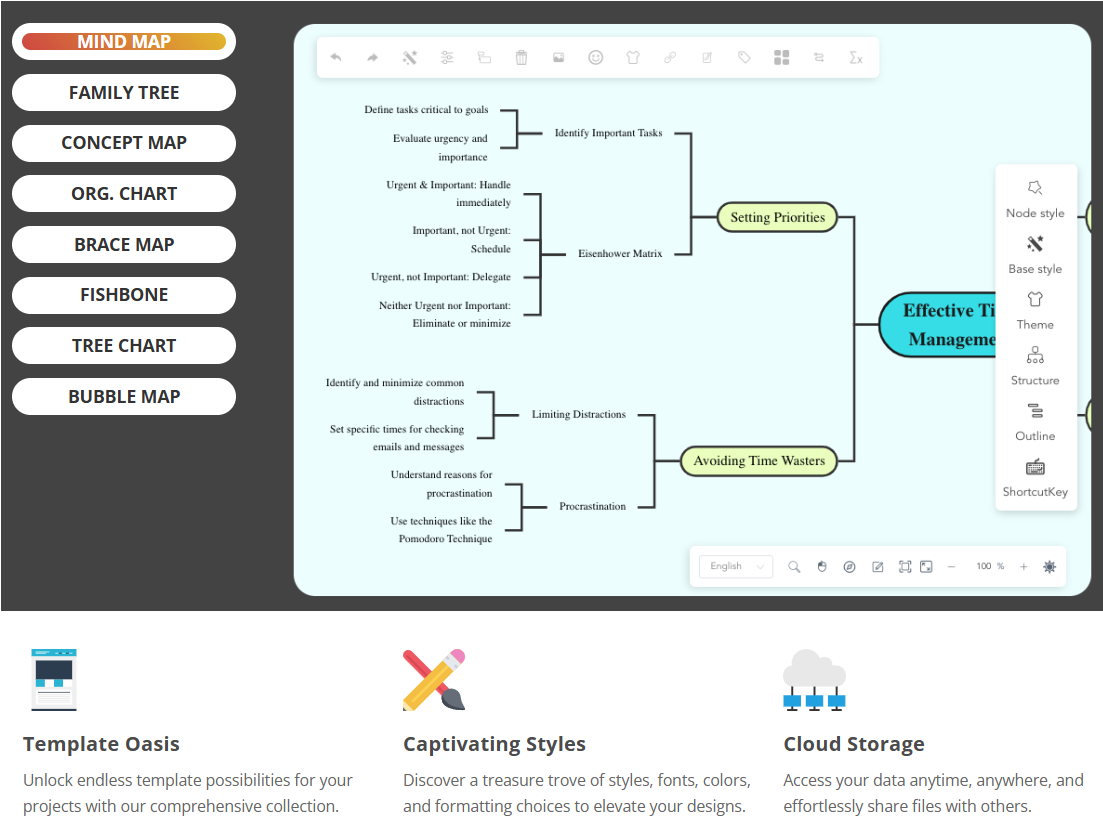
Visual Paradigm’s Smart Board is a versatile tool that can be used to create mind maps for various purposes, including project management. Here’s a step-by-step guide on how to create a mind map using Visual Paradigm’s Smart Board:
Step-by-Step Guide
…Comprehensive Guide to Mind Mapping for Project Management
Mind mapping is a powerful technique for project management that helps in organizing ideas, planning tasks, and visualizing project components. Below is a structured guide that outlines key aspects and applications of mind mapping in project management, along with examples …
Comprehensive Guide to Mind Mapping for Brainstorming
Mind mapping is a powerful technique for brainstorming that allows individuals and teams to visually organize thoughts and ideas. This method promotes creativity and clarity, making it easier to explore various concepts and generate new ideas. Below is a comprehensive …
Understanding Mind Map Art for Brainstorming
Mind mapping is a creative and effective technique for brainstorming ideas, particularly in artistic contexts. It allows individuals to visually organize their thoughts and explore concepts in a non-linear fashion, which can enhance creativity and idea generation.

