Ishikawa Diagram of Productivity Issues in Software Engineering
What: A Fishbone or Ishikawa diagram is a visual tool used for root cause analysis. It helps to identify and analyze the potential causes contributing to a specific problem or issue.
Why:
- It provides a structured approach to brainstorming and
Streamline Your Organizational Structure with Visual Paradigm Smart Board’s Free OBS Tool
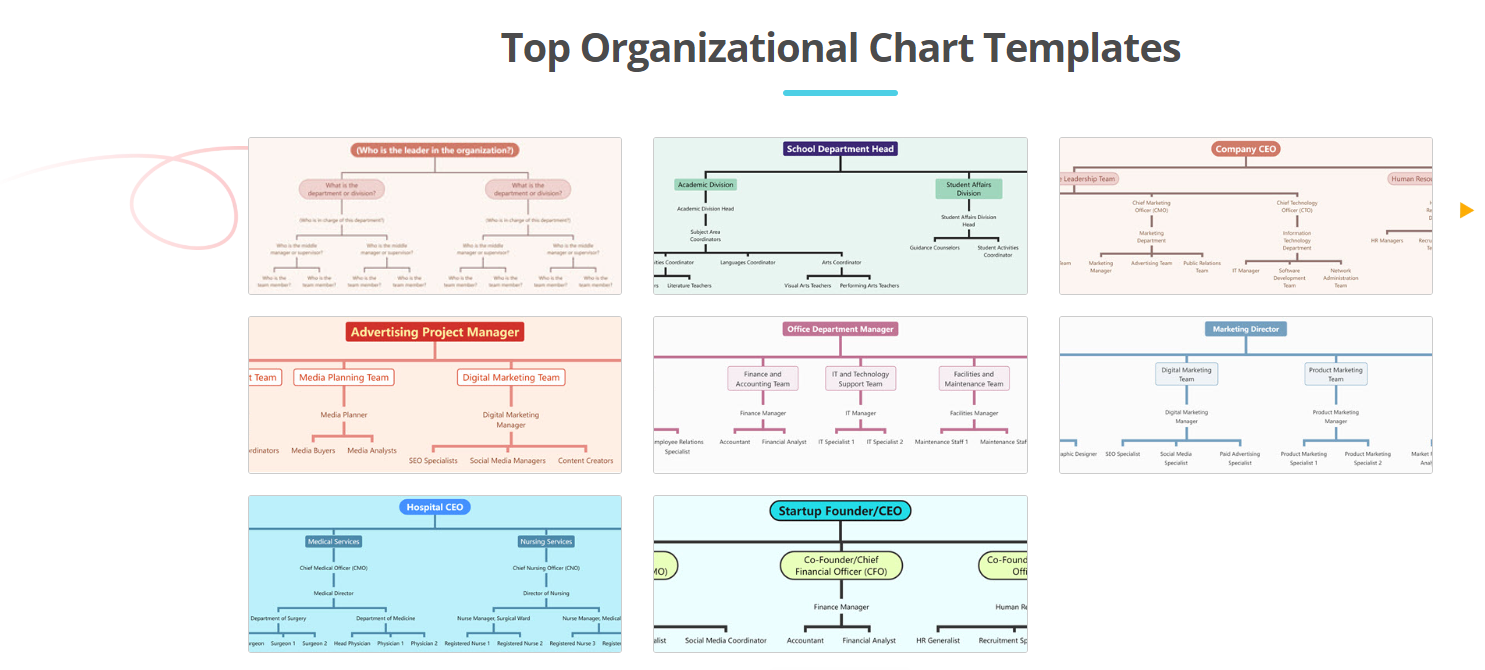
In the fast-paced world of modern business, the ability to visualize and manage organizational structures has become a critical component of success. Introducing Visual Paradigm Smart Board, a game-changing tool that empowers you to create professional, visually stunning Organizational …


