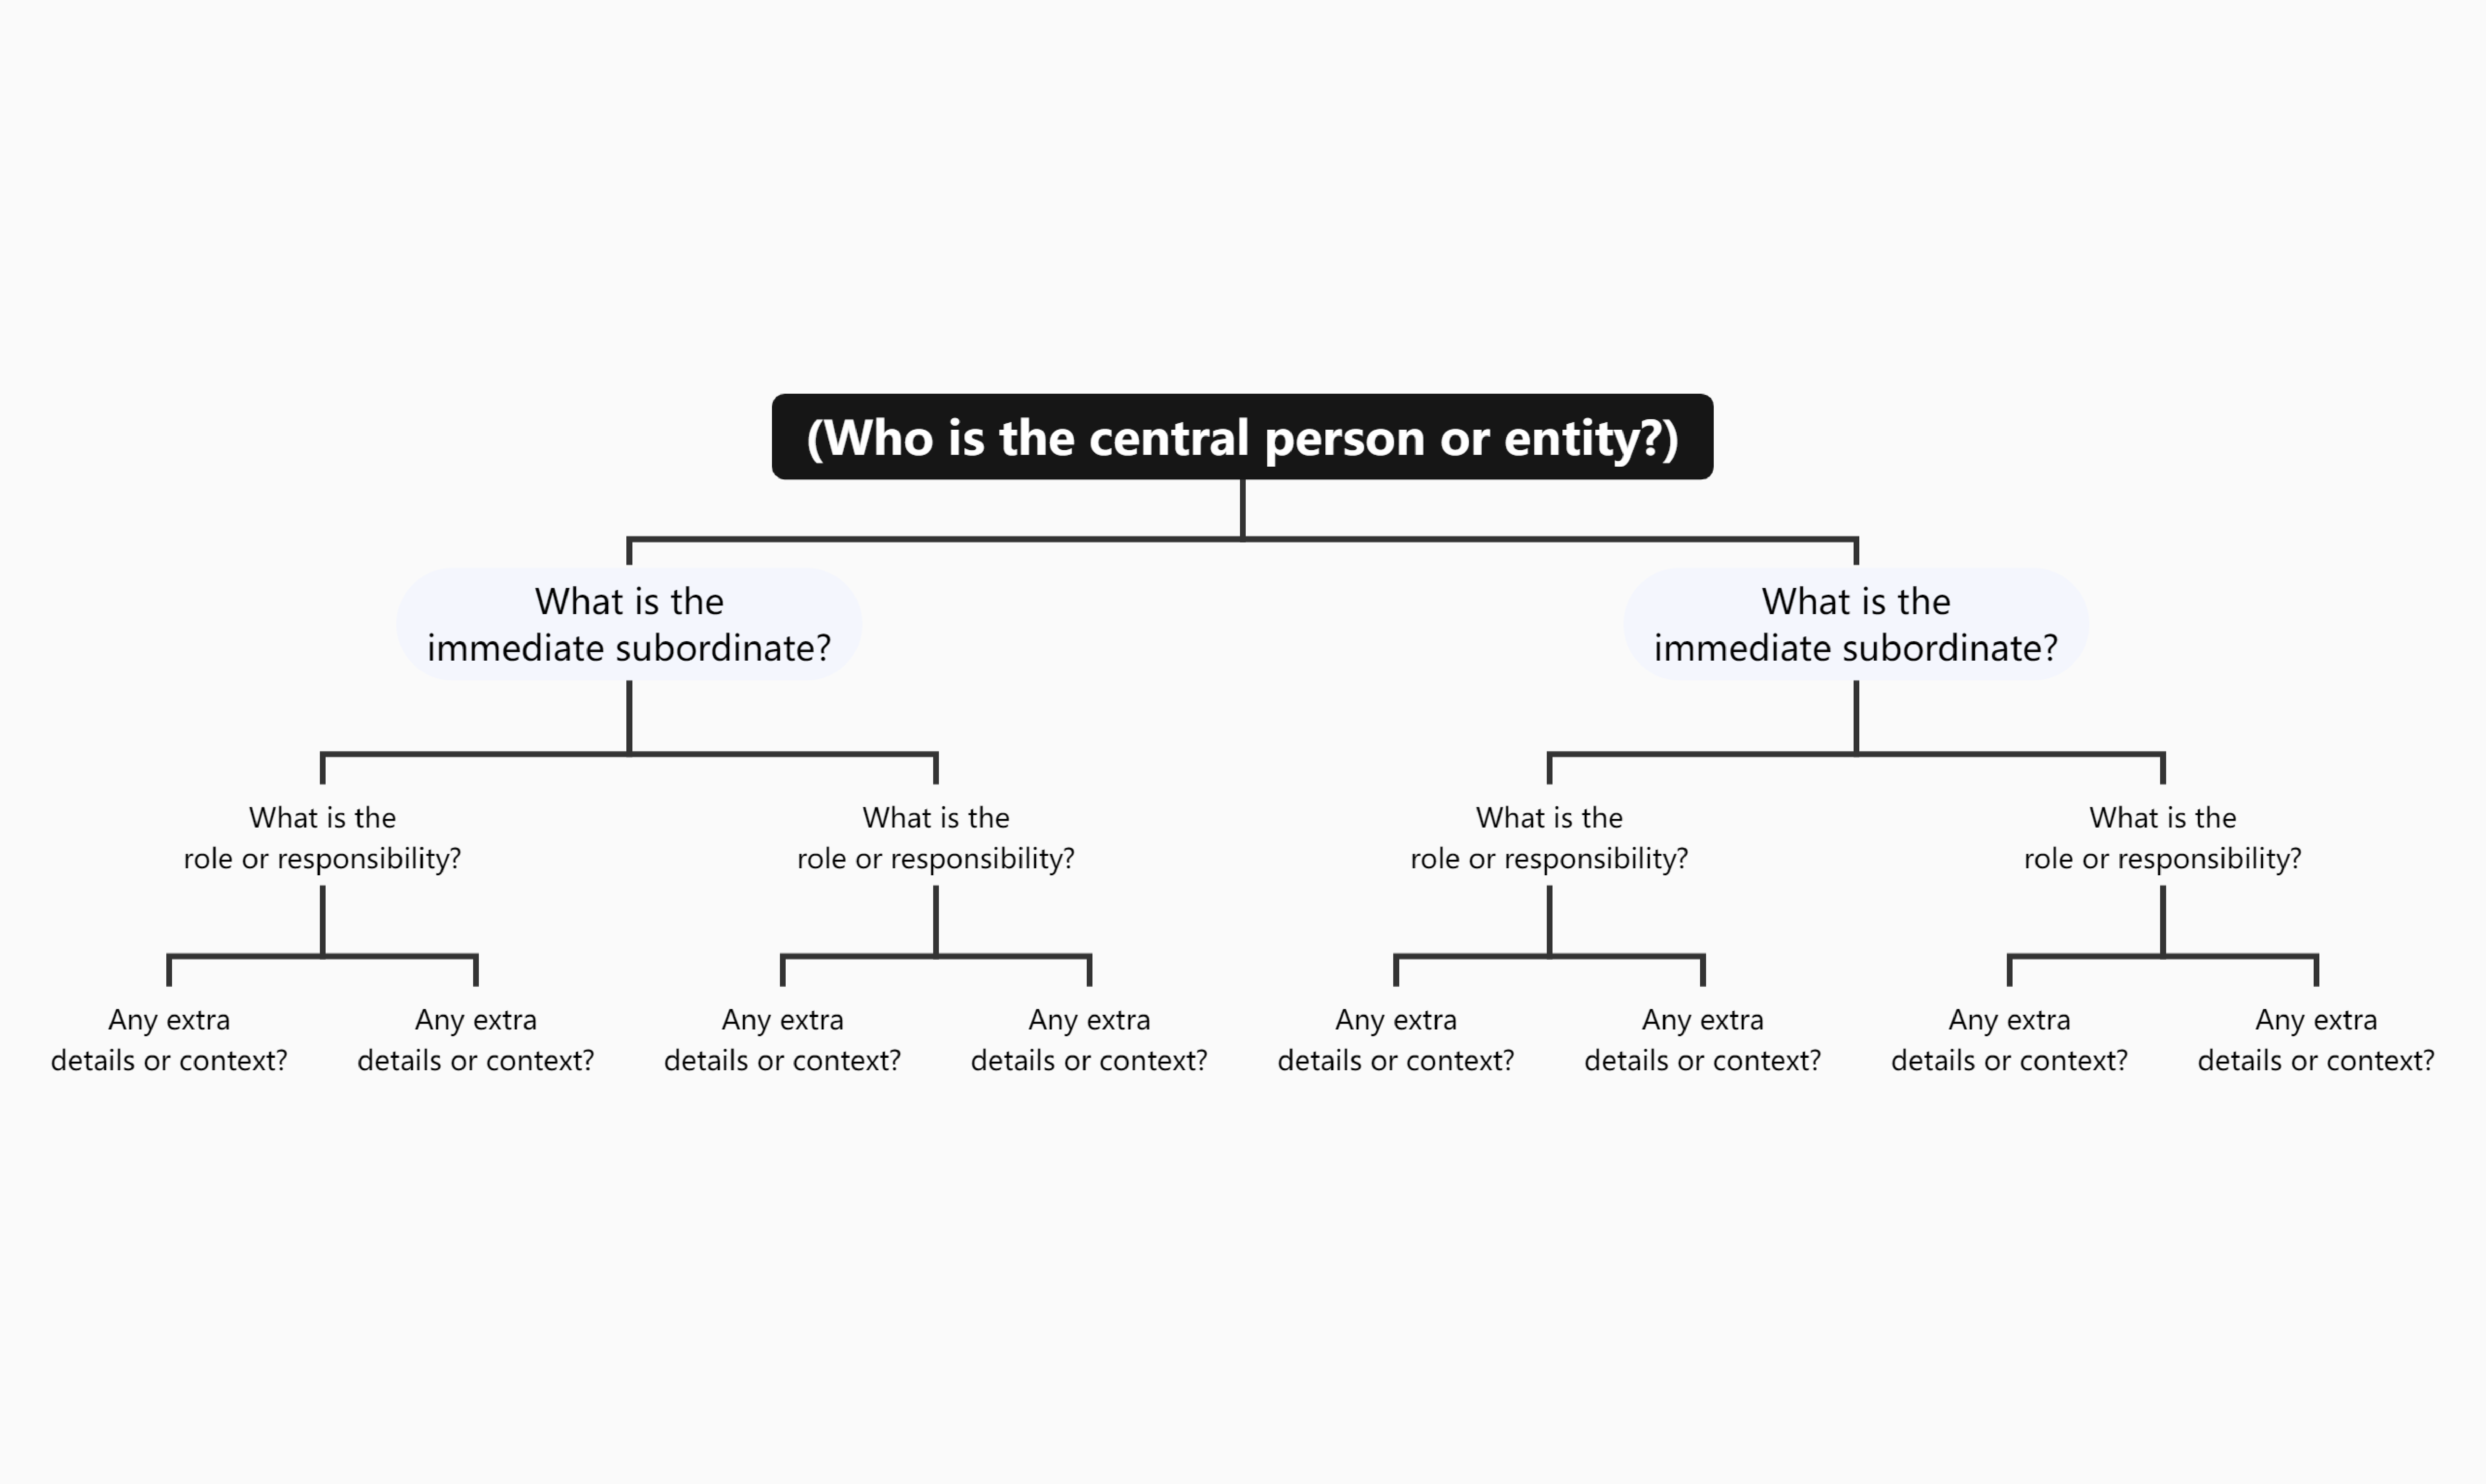
A tree chart, often referred to as a tree diagram or hierarchical chart, serves as a powerful visual representation of hierarchical structures, relationships, or classifications. This diagrammatic tool employs a tree-like structure, starting with a single root node that branches out into interconnected nodes or leaves, each representing different levels of a hierarchy.
Structure and Functionality
In a typical tree chart:
- Root Node: This is the starting point of the chart, representing the most general category or concept.
- Branches: These lines connect the root node to its subcategories, illustrating hierarchical relationships.
- Nodes/Leaves: Each node represents a category, concept, or element within the hierarchy. Leaves often denote the most specific items in the hierarchy.
Example

Tree charts are versatile and can be applied in various contexts, including:
- Organizational Structures: Displaying relationships within a company.
- Family Trees: Mapping out familial connections and lineage.
- Decision Trees: Facilitating decision-making processes by illustrating options and outcomes.
- Classification Systems: Organizing categories for better understanding and navigation.
By providing a clear and visually intuitive representation of complex information, tree charts effectively showcase the hierarchical relationships and dependencies within various systems.
Example Literary Genres
The image below provided is a comprehensive tree chart categorizing various literary genres. Let me walk through the structure and key elements:

- The root node at the top is “Literary Genres”, which is the overarching classification.
- The main branches stemming from the root are:
a. Fiction
b. Non-Fiction
c. Poetry
d. Drama - Diving deeper into the Fiction branch:
a. Novel
b. Short Story
c. Mystery
d. Romance
e. Fantasy
f. Horror
g. Crime
h. Tragedy
i. Comedy - The Non-Fiction branch includes:
a. Biography
b. Essay
c. Journalism
d. Memoir
e. Personal Essay
f. Academic Essay
g. Reflective Essay
h. News Reporting
i. Feature Writing
j. Editorial - The Poetry branch contains:
a. Narrative Poetry
b. Lyric Poetry
c. Sonnet
d. Haiku
e. Tragedy - The Drama branch includes:
a. Narrative Poetry
b. Lyric Poetry
c. Sonnet
d. Haiku
e. Tragedy
f. Comedy
g. Farce
This tree chart provides a comprehensive visual taxonomy of the major literary genres, neatly organizing them into a clear hierarchical structure. It is an effective tool for understanding the relationships and distinctions between different types of literary works, from novels and short stories to non-fiction essays and poetic forms. The granular level of detail showcases the depth and diversity within the literary landscape.
Distinguishing Tree Charts and Mind Maps
While both tree charts and mind maps are useful for representing hierarchical structures, they serve different purposes and exhibit distinct visual styles:
- Tree Charts:
- Follow a strict hierarchical layout.
- Feature a central root node that branches into subordinate nodes.
- Commonly used for formal applications like organizational charts, family trees, and decision trees.
- Mind Maps:
- Offer a more fluid and organic representation of ideas.
- Allow for non-linear, radial structures connecting a central idea to various branches.
- Best suited for brainstorming, idea generation, and exploring interconnected concepts.
The choice between using a tree chart or a mind map largely depends on the nature of the information being represented and the desired visual approach. Tree charts emphasize clarity and structure, while mind maps prioritize creativity and flexibility.
Crafting Tree Charts with Precision Using Visual Paradigm Smart Board
Creating structured tree charts is simplified with the Visual Paradigm Smart Board, an intuitive platform tailored for efficient diagramming. Whether you are mapping out organizational hierarchies, project structures, or decision trees, this tool offers a user-friendly interface with robust features.
Key Features of Visual Paradigm Smart Board:
- Drag-and-Drop Functionality: Easily manipulate nodes and branches to form your desired structure.
- Real-Time Collaboration: Work alongside team members to create and refine tree charts collaboratively.
- Visual Appeal: Design clear and aesthetically pleasing charts that effectively communicate hierarchical relationships.
By leveraging the capabilities of Visual Paradigm Smart Board, users can bring their structural tree charts to life in a digital space where simplicity meets sophistication, ensuring effective diagramming and visualization.
Conclusion
Tree charts are invaluable tools for visualizing hierarchical structures and relationships. Their ability to organize complex information in a clear, structured manner makes them essential in various fields. Whether used for organizational mapping, decision-making, or family lineage, tree charts facilitate understanding and communication. With platforms like Visual Paradigm Smart Board, crafting these diagrams has never been easier, enabling users to create precise and collaborative visual representations of their ideas.

Tree Chart Generic Template

Tree Chart of Musical Genres

Tree Chart of Economic Theories

Tree Chart of Evolutionary Biology

Tree Chart of Mathematics

Tree Chart of World Religions

Tree Chart of Literary Genres

Tree Chart of Psychological Theories

Tree Chart of Human Anatomy

Tree Chart of Space Exploration
