What is a Bubble Map?
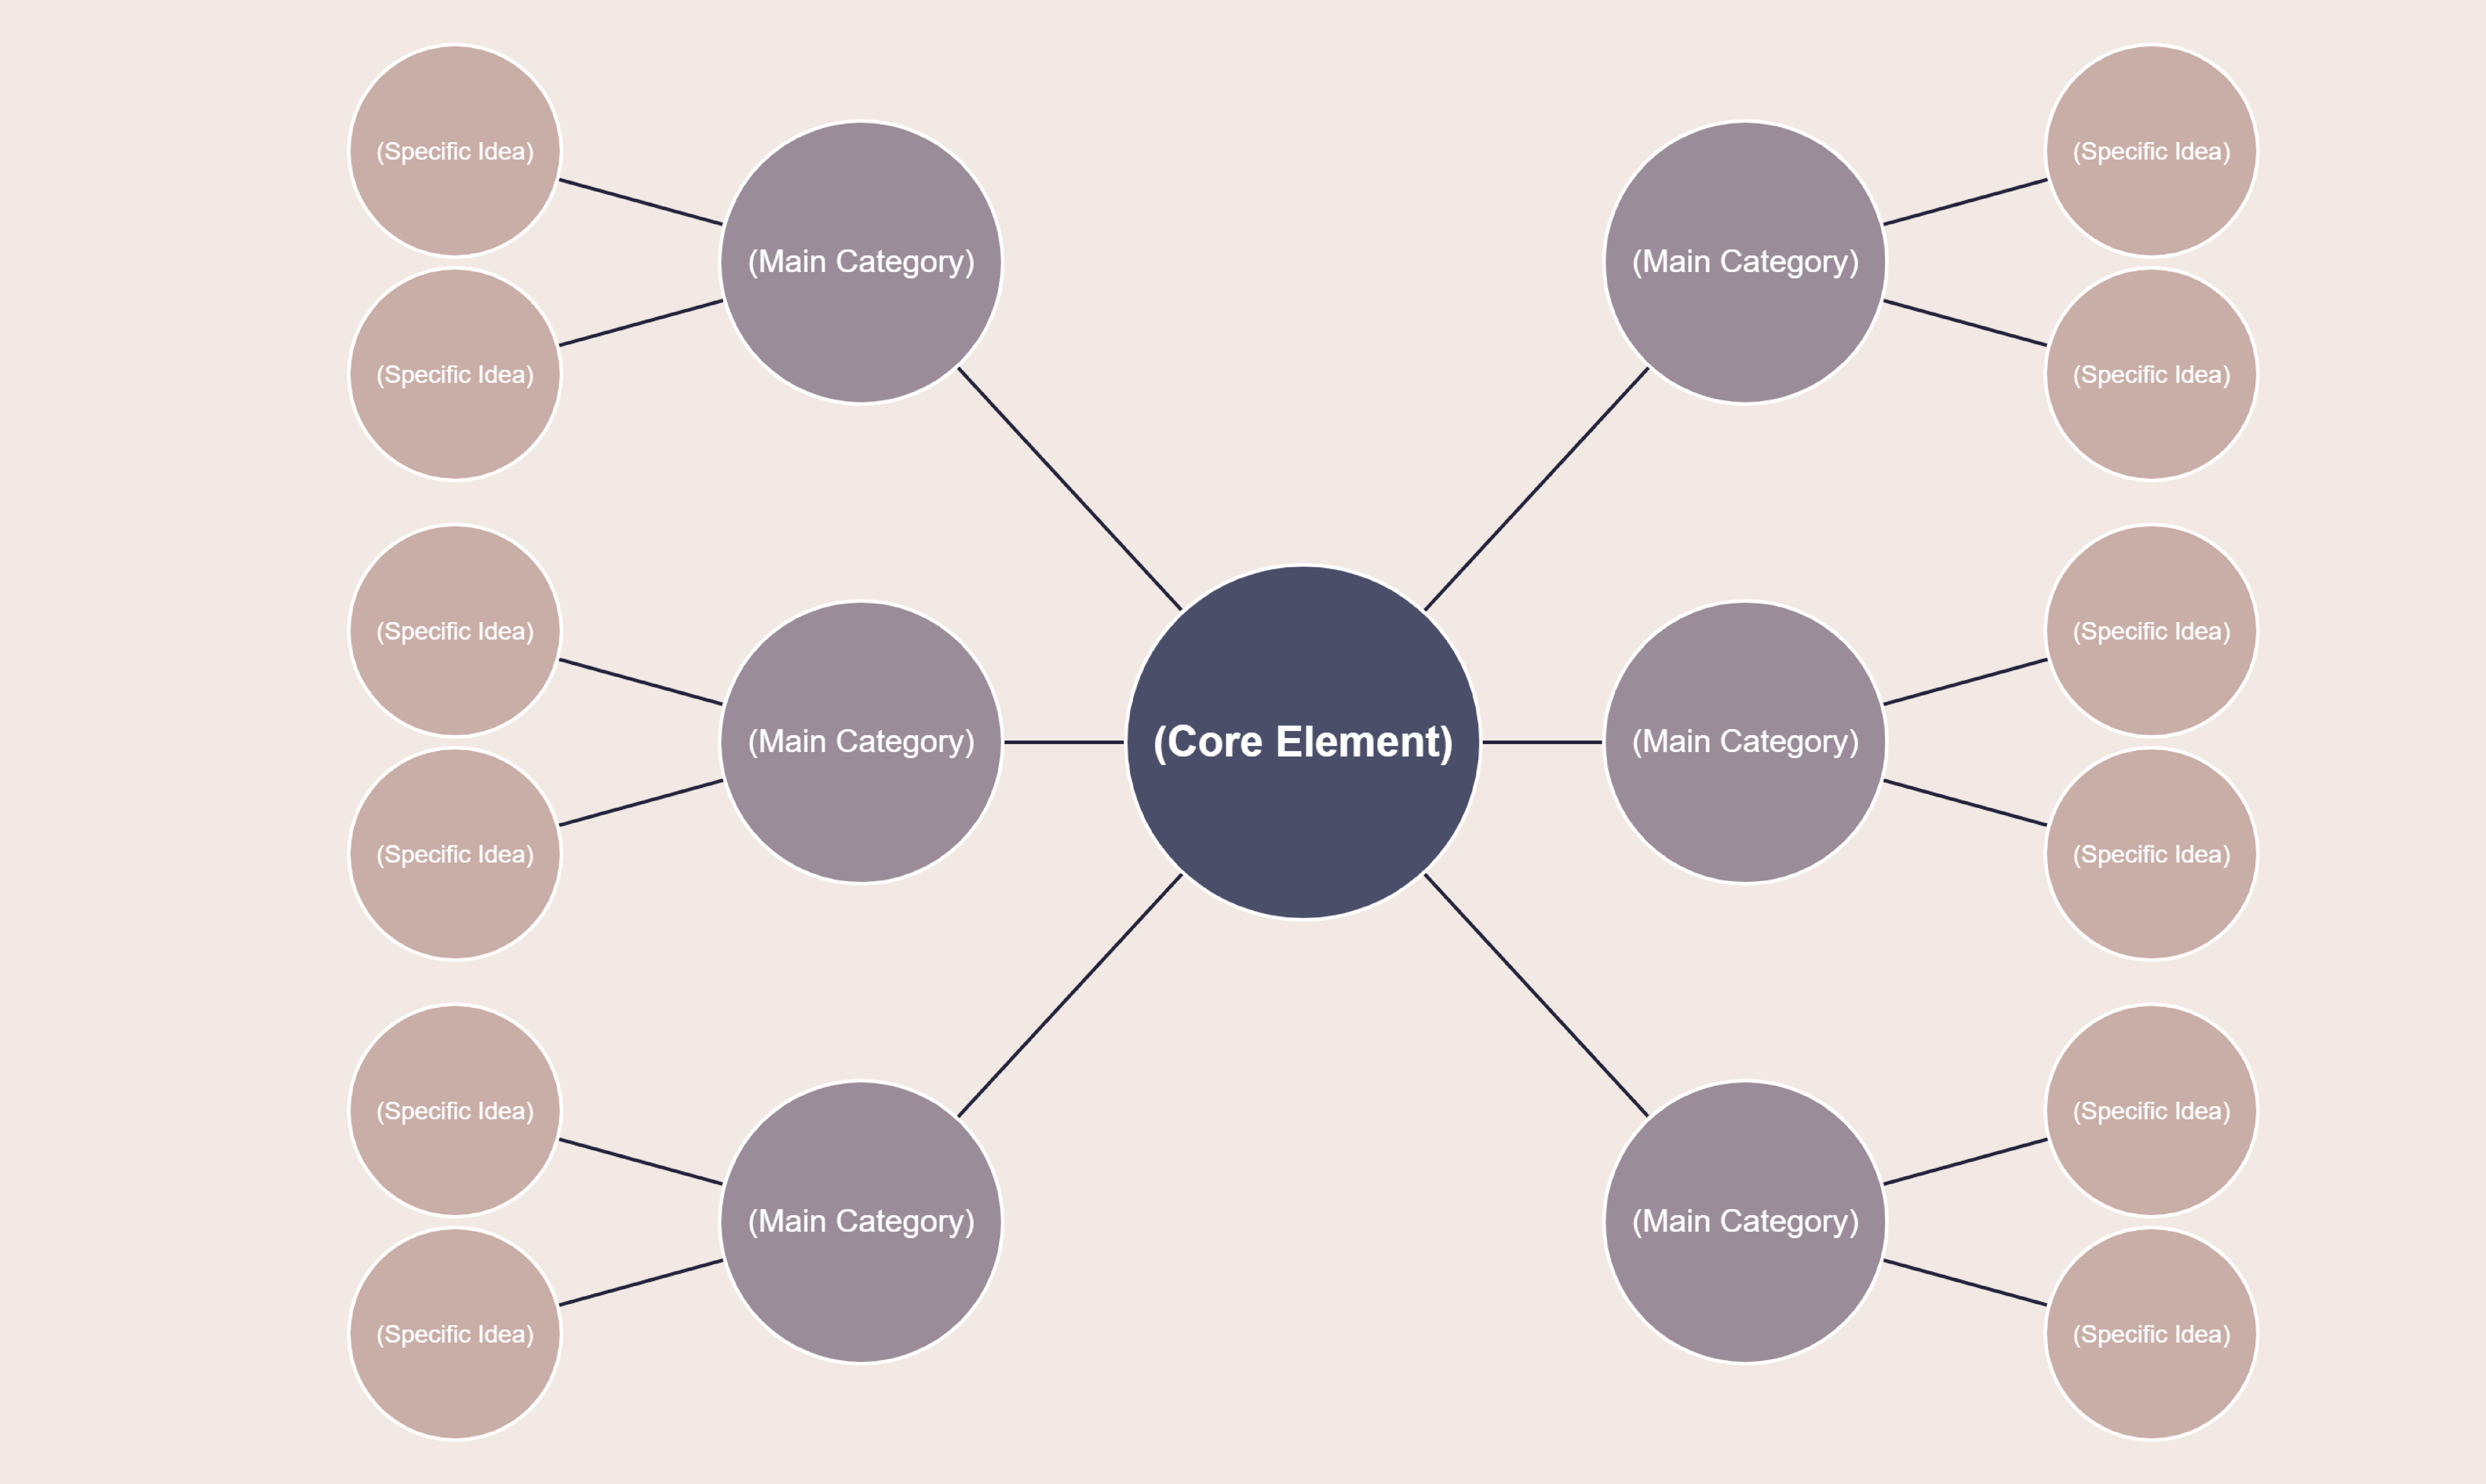
A Bubble Map is a type of visual diagram that organizes information and ideas into interconnected “bubbles” or circles. Each bubble represents a single concept, idea, or piece of information, and the bubbles are connected by lines or arrows to show the relationships between them.

Here is an example Bubble Map based on the structure based on the bubble map template above:
Central Topic: Effective Project Management
Core Element: Project Planning
Main Category: Team Collaboration
- Specific Idea: Clear Communication
- Specific Idea: Task Delegation
- Specific Idea: Progress Tracking
Main Category: Resource Allocation
- Specific Idea: Budget Management
- Specific Idea: Equipment/Supplies
- Specific Idea: Workforce Planning
Main Category: Timeline Management
- Specific Idea: Milestone Tracking
- Specific Idea: Contingency Planning
- Specific Idea: Deadline Prioritization
Main Category: Risk Mitigation
- Specific Idea: Identifying Potential Risks
- Specific Idea: Mitigation Strategies
- Specific Idea: Disaster Recovery
Main Category: Stakeholder Engagement
- Specific Idea: Client Communication
- Specific Idea: Executive Reporting
- Specific Idea: Vendor Coordination
This Bubble Map centers around the core element of “Project Planning” within the broader context of “Effective Project Management.” The main categories branching out from the core element cover key aspects of successful project planning, such as team collaboration, resource allocation, timeline management, risk mitigation, and stakeholder engagement.
Each main category then has several specific ideas or sub-topics that delve deeper into the various components of that particular aspect of project planning. For example, under “Team Collaboration,” the specific ideas include clear communication, task delegation, and progress tracking.
This structure allows for a comprehensive and organized representation of the different elements that contribute to effective project planning, which is a crucial component of overall project management success.
Why Use Bubble Maps?
Bubble Maps are a powerful tool for:
- Brainstorming and generating ideas
- Organizing and structuring information
- Visualizing complex concepts and relationships
- Problem-solving and decision-making
- Enhancing learning and understanding
The visual nature of Bubble Maps makes it easier to identify patterns, see connections, and explore new possibilities. They are particularly useful for tasks that involve creativity, analysis, and holistic thinking.
When to Use Bubble Maps?
Bubble Maps can be used in a variety of contexts, including:
- Planning projects and strategies
- Developing new products or services
- Analyzing and solving problems
- Studying complex topics and subjects
- Organizing personal or professional information
- Facilitating team discussions and meetings
The flexibility of Bubble Maps makes them applicable to a wide range of applications, from business and education to personal development and leisure activities.
How to Create Bubble Maps with Visual Paradigm Smart Board
Visual Paradigm Smart Board provides a user-friendly interface for creating and customizing Bubble Maps. Here’s how to get started:
- Access the Bubble Map Tool: In the Visual Paradigm Smart Board workspace, click on the “Create New” button and select “Bubble Map” from the options.
- Add and Arrange Bubbles: Begin by adding your first bubble to the canvas. You can add more bubbles by pressing the “Enter” key to create sibling bubbles or the “Tab” key to create child bubbles. Arrange the bubbles by dragging and dropping them into the desired positions.
- Edit Bubble Content: Double-click on a bubble to edit its text content. You can also adjust the size and appearance of the bubbles using the formatting tools in the sidebar.
- Create Connections: Connect bubbles by dragging a line from one bubble to another. You can customize the line style, color, and direction as needed.
- Customize the Layout: Use the “Base Style” options to adjust the overall layout and distribution of the bubbles on the canvas. You can enable “Node Free Drag” to manually position the bubbles.
- Add Images and Media: Enhance your Bubble Map by incorporating relevant images or other media. Simply click on a bubble, select the “Image” option, and upload your desired file.
- Organize Content with Outlines: If you prefer to work with text-based input, you can use the “Outline” feature to add and structure your content, which will automatically update the visual Bubble Map.
- Export and Share: Once you’re satisfied with your Bubble Map, you can export it in various formats, such as images, PDF, or HTML, to share with others or incorporate into your projects.
Remember, the key to effective Bubble Map creation is to embrace the flexibility and creativity of the tool. Experiment with different layouts, styles, and content to find the best way to visualize and communicate your ideas.
By leveraging the powerful features of Visual Paradigm Smart Board, you can create professional-looking Bubble Maps that enhance your problem-solving, decision-making, and communication abilities.
Learn More Bubble Map Examples

Bubble Map

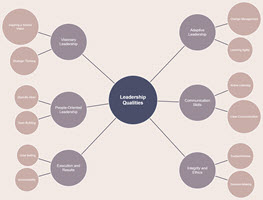
Bubble Map of Leadership Qualities

Bubble Map of Cultural Diversity in Education
